Redash
In the ever-expanding universe of business intelligence tools, Redash has emerged as a powerful open-source platform that’s revolutionizing how teams interact with their data. With its SQL-first approach and collaborative features, Redash has found a sweet spot between developer-friendly functionality and accessible visualization tools that makes it uniquely valuable in today’s data-driven landscape.
Redash was born from a simple yet profound observation: while organizations were collecting more data than ever, access to this information remained bottlenecked through data teams. Founded by Arik Fraimovich in 2013, Redash began as an internal tool at EverythingMe to democratize access to data across the organization.
The founding philosophy was straightforward—enable anyone with SQL knowledge to query data directly, visualize results instantly, and share insights seamlessly. This vision of data democracy resonated widely, leading to Redash’s open-source release and eventual acquisition by Databricks in 2020.
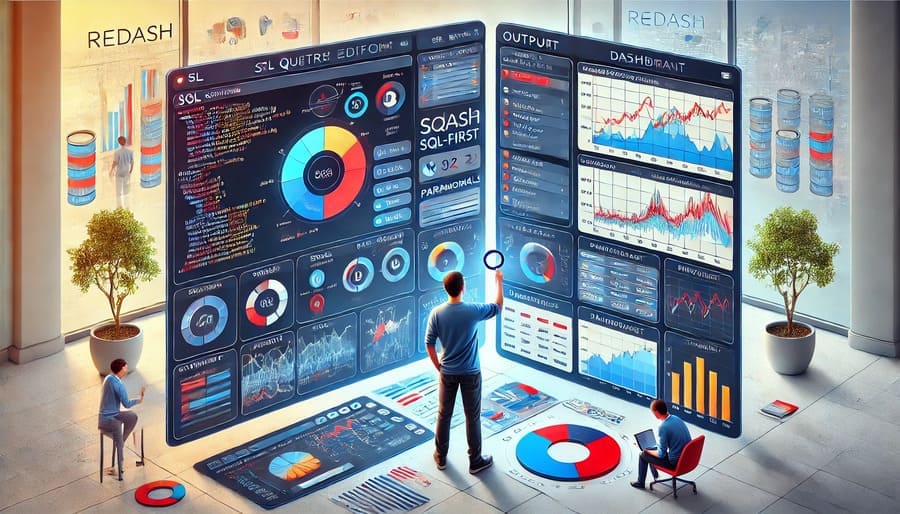
While many BI tools focus primarily on visual interfaces that abstract away the underlying queries, Redash embraces SQL as its fundamental language:
- Direct Database Interaction: Write queries directly against your data sources
- Query Library: Build and maintain a centralized repository of SQL knowledge
- Version Control: Track changes to queries over time
- Snippets: Reuse common SQL fragments across multiple queries
- Parameterization: Turn static queries into dynamic, interactive tools
This approach empowers data analysts and engineers to leverage their SQL expertise while still providing accessible visualizations for business users.
One of Redash’s most powerful features is its sophisticated parameter system:
- Dynamic Filtering: Allow users to modify queries without writing SQL
- Dropdown Menus: Create selectable options for common filters
- Date Range Pickers: Implement flexible time-based analysis
- Text Inputs: Enable free-form search and filtering
- Query-Based Parameters: Use the results of one query to filter another
These parameters transform static reports into interactive tools, enabling non-technical users to explore data within safe boundaries defined by analysts.
Once data is queried, Redash offers numerous ways to visualize the results:
- Chart Library: Access to standard visualizations like bar, line, and pie charts
- Interactive Tables: Sortable, searchable data tables with conditional formatting
- Geographical Maps: Plot location-based data with various map types
- Cohort Analysis: Track user groups over time
- Counter Displays: Highlight key metrics and KPIs
- Custom Visualizations: Add community-developed visualization types
Redash recognizes that insights gain value when shared and discussed:
- Shared Dashboard Creation: Multiple users can contribute visualizations
- Access Controls: Granular permissions for viewing and editing
- Embeddable Visualizations: Integrate charts into other platforms
- Scheduled Reports: Deliver insights via email on regular schedules
- API Access: Programmatically interact with Redash resources
- Version History: Track changes and restore previous versions
Redash is built on a modern stack that balances performance with flexibility:
- Frontend: React-based user interface for responsive interactions
- Backend: Python Flask application server
- Query Execution: Celery for asynchronous query processing
- Caching: Redis for query result caching
- Storage: PostgreSQL for application metadata
- Container-Ready: Docker support for simplified deployment
One of Redash’s key strengths is its extensive data source support:
- Relational Databases: PostgreSQL, MySQL, SQL Server, Oracle
- Data Warehouses: Amazon Redshift, Google BigQuery, Snowflake
- NoSQL Databases: MongoDB, Elasticsearch, Cassandra
- Analytics Platforms: Google Analytics, Mixpanel
- File-Based Sources: CSV uploads, JSON APIs
- Big Data Systems: Hadoop, Spark, Presto, Hive
This connectivity enables organizations to unify analytics across disparate data sources without expensive data migration projects.
Redash excels in diverse organizational contexts:
Early-stage companies leverage Redash for:
- Product Analytics: Tracking user behavior and feature adoption
- Growth Metrics: Monitoring acquisition channels and conversion rates
- Financial Oversight: Analyzing runway and unit economics
- A/B Test Results: Evaluating experimental outcomes
- Customer Success: Identifying potential churn risks
The open-source nature and straightforward deployment make Redash particularly attractive for resource-conscious startups.
Technical teams appreciate Redash for:
- Data Exploration: Rapid investigation of datasets
- Pipeline Monitoring: Tracking ETL processes and data quality
- Experiment Results: Sharing findings from analytical models
- System Performance: Monitoring infrastructure metrics
- Ad-hoc Analysis: Quick answers to unexpected questions
Operational teams utilize Redash for:
- Sales Dashboards: Tracking pipeline and conversion metrics
- Marketing Performance: Analyzing campaign effectiveness
- Support Metrics: Monitoring ticket volume and resolution times
- Inventory Management: Visualizing stock levels and movement
- Resource Allocation: Optimizing team assignments and capacity
Organizations implementing Redash can maximize value through these approaches:
Organize your query library for long-term maintainability:
- Create clear naming conventions for queries
- Group related queries into logical collections
- Document queries with comprehensive descriptions
- Tag queries for improved searchability
- Implement standardized parameter patterns
Create effective dashboards through thoughtful design:
- Begin with key questions the dashboard should answer
- Arrange visualizations in a logical flow
- Maintain consistent formatting across charts
- Use text boxes to provide context and explanations
- Implement dashboard-level filters for unified interactivity
Set up a sustainable technical environment:
- Allocate appropriate resources based on user load
- Implement proper backup procedures
- Set up monitoring for system health
- Configure result caching for performance optimization
- Establish user authentication and authorization patterns
Maximize organizational value through thoughtful rollout:
- Identify and train power users in each department
- Create starter dashboards for common use cases
- Establish regular office hours for query assistance
- Develop internal documentation for organization-specific practices
- Recognize and showcase valuable insights discovered through Redash
Understanding where Redash fits in the analytics ecosystem helps organizations make informed decisions:
- Strengths: Direct SQL access, faster implementation, open-source flexibility, developer-friendly
- Considerations: Less polished for pure business users, fewer point-and-click features, requires some SQL knowledge
- Strengths: Cost-effectiveness, data sovereignty, customization flexibility, query library approach
- Considerations: Requires self-hosting, less automated visualization recommendations, more technical administration
- Strengths: Dramatically faster implementation, built-in visualization library, collaboration features
- Considerations: Less customizable UI, some limitations in embedding options
Following the Databricks acquisition, several development paths have emerged:
- Tighter integration with Delta Lake
- Enhanced support for Spark SQL
- Simplified connectivity to Databricks environments
- Machine learning results visualization
- Streamlined deployment in cloud environments
The active open-source community continues to enhance:
- New visualization types
- Additional data source connectors
- Performance improvements
- Security enhancements
- Extended API capabilities
For organizations ready to explore Redash, here’s a streamlined approach:
- Choose between Docker-based installation or cloud deployment
- Configure essential data source connections
- Set up user authentication
- Establish basic permission structures
- Deploy in a test environment before production
- Inventory available data sources
- Prioritize connections based on analytical value
- Establish connection credentials and permissions
- Document schema information for key tables
- Create foundational data views if needed
- Build a library of fundamental queries
- Implement parameterization for flexibility
- Document queries thoroughly
- Establish query performance best practices
- Create reusable query snippets
- Identify key business questions to answer
- Design dashboard layouts
- Implement interactive elements
- Add contextual information
- Set appropriate refresh schedules
- Identify pilot user groups
- Conduct focused training sessions
- Establish support mechanisms
- Gather and incorporate feedback
- Expand to additional departments
In an era where data-driven decision making is essential but technical resources are constrained, Redash offers a compelling balance—empowering SQL-savvy users to create and share insights while making those insights accessible to the broader organization.
What makes Redash particularly valuable is its recognition that different users engage with data differently. Analysts and engineers can write complex SQL directly, while business users can interact with parameterized reports and visualizations. This hybrid approach bridges the gap between technical and non-technical teams, creating a shared language for organizational data.
As data volumes continue to grow and organizations increasingly recognize the competitive advantage of data democratization, tools like Redash that emphasize accessibility, flexibility, and collaboration will play an increasingly important role. Whether you’re a startup looking for cost-effective analytics, a data team seeking to reduce request backlogs, or an enterprise aiming to complement existing BI investments with more agile tools, Redash offers a compelling approach to turning data into actionable insights.
By embracing the query-visualize-share workflow that defines modern data analysis, Redash helps organizations build a culture where data isn’t just collected and stored, but actively leveraged to drive better decisions at every level.
#Redash #DataVisualization #OpenSourceBI #SQLAnalytics #BusinessIntelligence #DataDemocracy #ParameterizedQueries #DataDashboards #AnalyticsPlatform #DataCollaboration #BusinessDashboards #DataAnalytics #QueryLibrary #DataDriven #Databricks